The Power to Choose Community: Participant-Directed Services and the Role of Supports Brokers in Creating Inclusive Communities

Authors: Jamie Ray-Leonetti, Institute on Disabilities at Temple University; and Javier Salazar and Marian Frattarola-Saulino, Values Into Action

Two classmates outside Temple University Student Center, one using wheelchair

What is Participant-Directed Services?

Participant-Directed Services are home and community-based services that help people of all ages across all types of disabilities maintain their independence and determine for themselves what mix of personal assistance supports and services work best for them. Participant-directed services are sometimes referred to as consumer-directed or self-directed services.1

How Does Participant Direction Work in Pennsylvania?

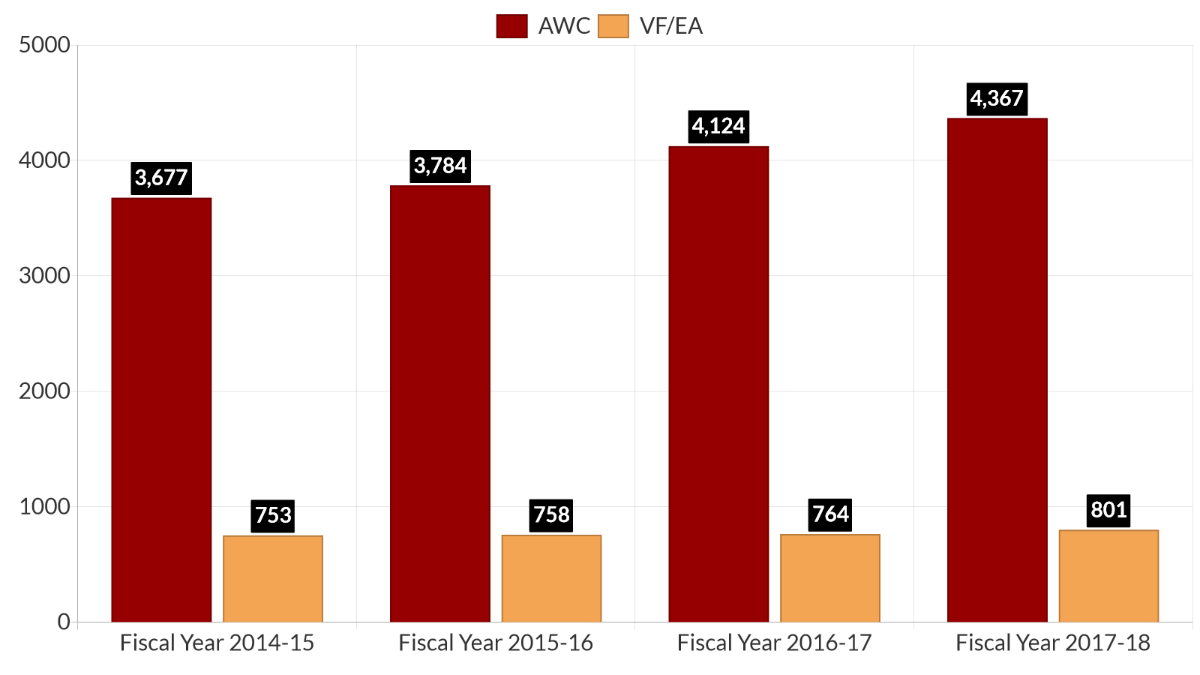
Participant Direction, also known as self-direction, means that the participant or their surrogate (representative) has decided to become a Common Law Employer or a Managing Employer. To do this, you must use a Financial Management Service (FMS) Organization or Agency with Choice (AWC). When you become the Common Law Employer or Managing Employer you are able to make decisions about some or all of the supports and services authorized in your person-centered Individual Support Plan (ISP).

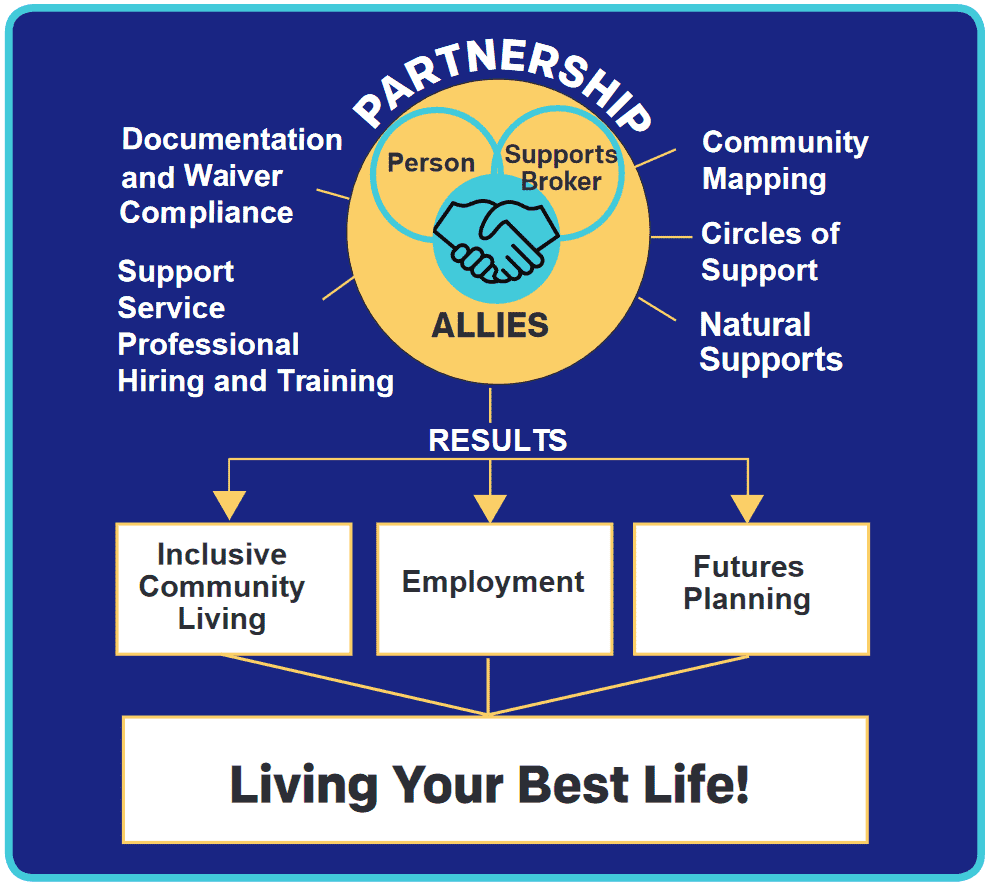
Aligning with principles of self-determination, Person Driven Services and Supports provide a model whereby people with disabilities have more control over where, when, how, and by whom their supports are provided.

What is the Role of a Supports Broker?

Designed to assist participants or their designated surrogate with employer-related functions in order to be successful in self-directing some or all of the participant’s needed services.2

A Supports Broker Can

  1. Enhance Natural Supports
  2. Provide Support with Employer-Related Responsibilities
  3. Assist to Ensure Compliance with Program Rules and Planning


How Does Partnership with a Supports Broker Lead to Inclusive Communities?

illustration of the partnership between a person and their supports broker and its results

Partnership Image Description

A dark blue square contains white and gold text, shapes, and symbols. Within the square, a gold circle labeled "Partnership" contains overlapping circles labeled "Person" and "Supports Broker," which are overlapped by a handshake icon.

Text around the circle: "Documentation and Waiver Compliance," "Support Service Professional Hiring and Training," "Community Mapping," "Circles of Support," "Natural Supports."

Below the circle, the heading "Results" is above arrows pointing to squares with text: "Inclusive Community Living," "Employment," and "Futures Planning." All three squares are connected by lines to a rectangle with text: "Living Your Best Life."

Performance Measures

3 photos of people receiving supports, in classroom, learning technology, and during meal time


  1. Number of Individuals and Self-Advocates who use PDS, by AWC (Agency with Choice) and VF/EA (Vendor Fiscal /Employer Agent).2

    (Source: September 30, 2018 HCSIS)

    • Fiscal Year 2014-15: AWC 3,667; VF/EA 753.
    • Fiscal Year 2015-16: AWC 3,784 ; VF/EA 753.
    • Fiscal Year 2016-17: AWC 4,124 ; VF/EA 764.
    • Fiscal Year 2017-18: AWC 4,367 ; VF/EA 801.
    Bar chart of number of individuals and self-advocates using PDS, by AWC and VF/EA
  2. Number of Self-Directed Services per Individual/Self-Advocate; will include support broker.2

    (Source: September 30, 2018 HCSIS)

    • Fiscal Year 2014-15: 1 service - 2,821; 2 services - 1,056; 3> services - 530.
    • Fiscal Year 2015-16: 1 service - 2,828; 2 services - 1,108; 3> services - 587.
    • Fiscal Year 2016-17: 1 service - 3,036; 2 services - 1,198; 3> services - 632.
    • Fiscal Year 2017-18: 1 service - 3,255; 2 services - 1,281; 3> services - 607.
    Bar chart, number of self-directed services per individual/self-advocate
  3. Percent of Individuals and Self-Advocates who use PDS, including AWC and VF/EA.2

    (Source: September 30, 2018 HCSIS. Includes AWC and VF/EA Services; individuals enrolled in Consolidated and P/FDS Waivers, and Base Program)

    • Fiscal Year 2014-15: 11%.
    • Fiscal Year 2015-16: 12%.
    • Fiscal Year 2016-17: 12%.
    • Fiscal Year 2017-18: 13%.
    Bar chart, percentage of individuals and self-advocates who use PDS, including AWC and VF/EA


  1. http://www.nasuad.org/hcbs/participant-directed-services
  2. https://myodp.neindex.org/wp-content/uploads/2022/03/2018ISACAnnualRepor...